
Revolutionize Security:Elastic Stack SIEM Lab Setup
Elastic
Stack SIEM Lab
What is a SIEM?

In contemporary cybersecurity, a Security Information and Event Management (SIEM) system is essential. It gathers and examines data from a range of IT infrastructure resources, such as servers, network devices, domain controllers, and more. Applications and network hardware-generated security alarms can be analyzed in real-time by SIEM systems. They are necessary for incident response, threat identification, and regulatory compliance.
Purpose and Benefits
Offering a thorough understanding of an organization’s information security is the main goal of a SIEM. SIEM systems are able to detect trends and abnormalities that point to possible security issues by combining log data from several sources. This makes it possible for businesses to react to events promptly, lessening the effect of security breaches and guaranteeing adherence to rules and guidelines on security. Furthermore, PCI-DSS, HIPAA, and GDPR compliance reports are generated with the aid of SIEM tools.
My SIEM Project
In my project, “Elevated Insights: Unleashing the Power of an Elastic SIEM,” I set up a home lab using Elastic Stack for Security Information and Event Management. This project demonstrates the practical steps to configure and utilize a SIEM, including generating security events, setting up an agent to forward data, and analyzing logs for security insights. This hands-on experience showcases my skills in implementing and managing a SIEM, highlighting my proficiency in threat detection and response, and solidifying my foundation in cybersecurity.
An overview of the Tasks
- Create a free account on Elastic.
- Set up the virtual machine for Kali.
- Set up the Linux virtual machine’s Elastic Agent to gather logs and send them to the SIEM.
- On the Kali virtual machine, create security events.
- To locate security events in the Elastic SIEM, run a query.
- In order to visualize security occurrences, create a dashboard.
- For security events, create notifications.
First Task: Create an Elastic Account
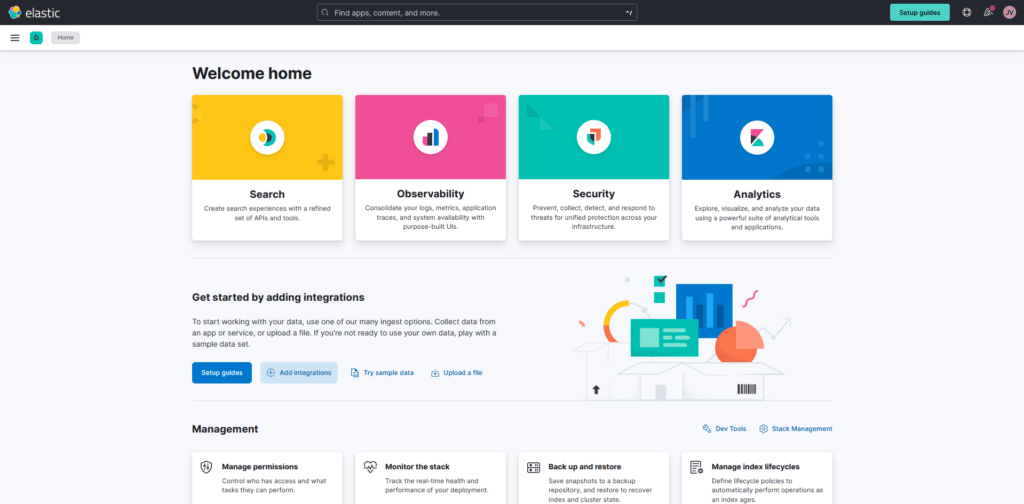
I first set up a cloud instance for the SIEM and register a free Elastic account. Here’s how to go about it:
1. I would began to visit Elastic Cloud(https://cloud.elastic.co/registration) to sign up for a free trial.
2. Visit Elastic Cloud(https://cloud.elastic.co) to access the Elastic Cloud console.
3. I select “Initiate a free trial.”
4. Then click “Create Deployment” and select “Elasticsearch” as the deployment type.
5. Select the deployment size and region that best fit the requirements, then click “Create Deployment.”
6. Await the configuration’s conclusion.
When it’s prepared, select “Continue.”
Task 2: Configuring the virtual machine for Linux
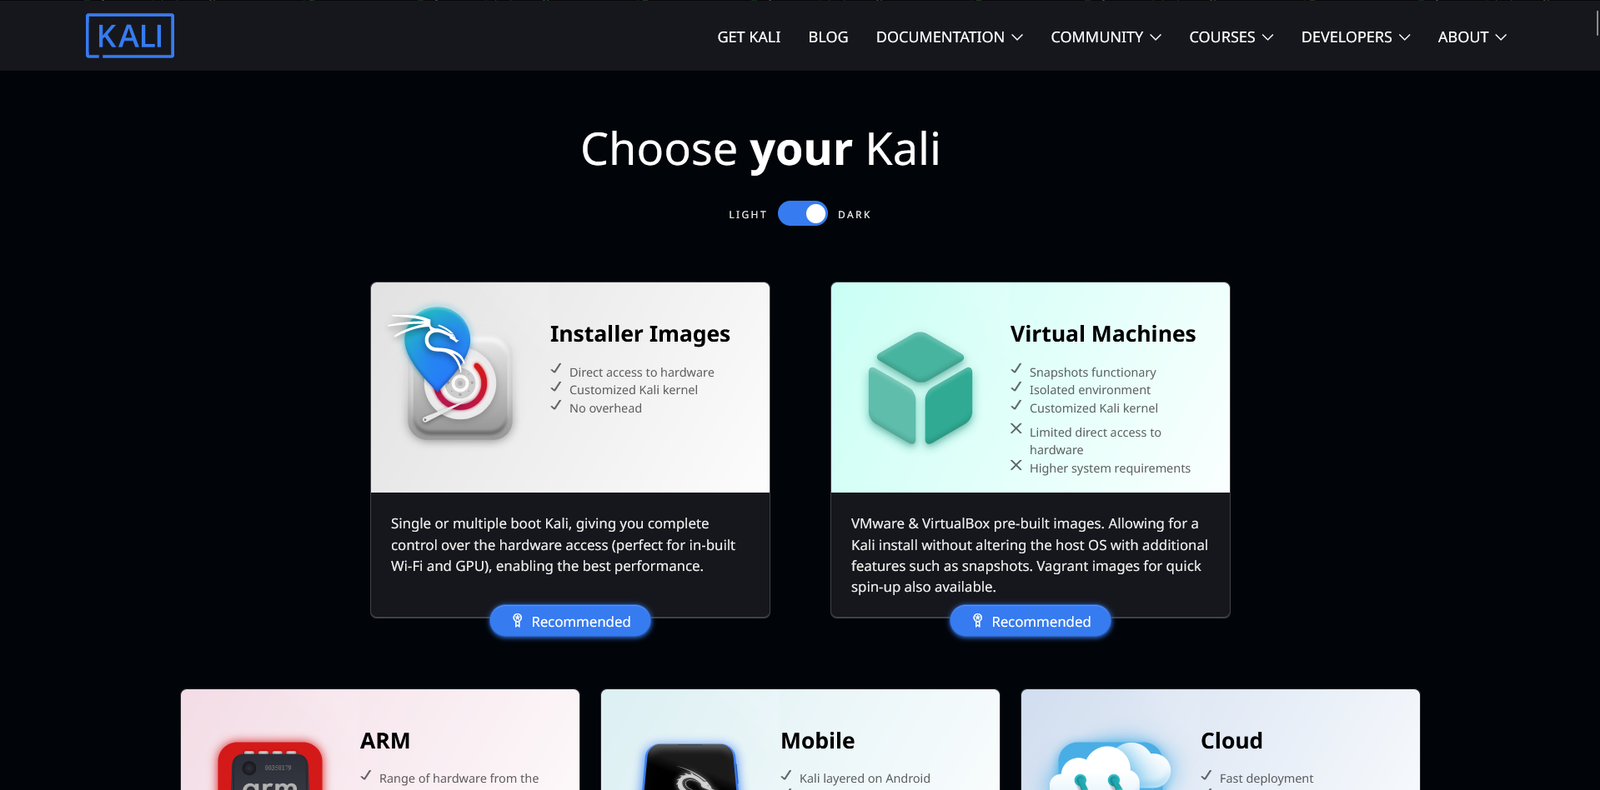
The Linux VM has to be configured next. I’ll be using Kali Linux and Oracle VirtualBox, but you may use any Linux operating system and virtualization program for this.
To configure it, I did the following:
- Visit the official Kali website at https://www.kali.org/get-kali/#kali-virtual-machines to get the Kali Linux virtual machine.
- Using the Kali VM file, create a new virtual machine (VM) in your favorite virtualization software, like VMware or VirtualBox
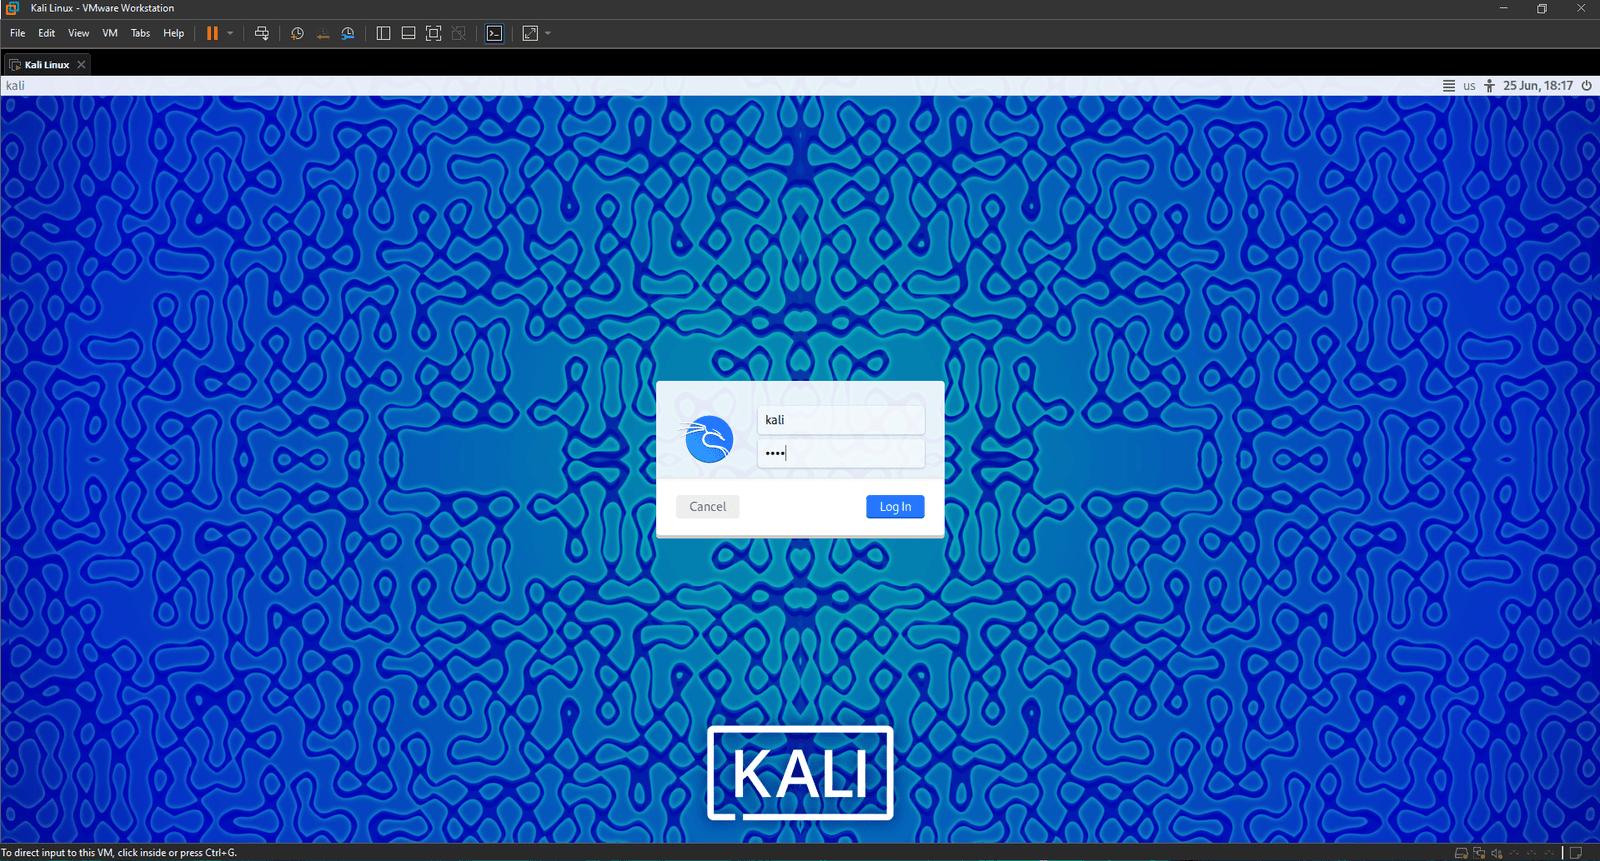
- To install Kali, launch the virtual machine and follow the on-screen instructions.
- After the installation is finished, use the login and password “kali” to access the Kali virtual machine.
Task 3: Configuring the Agent to Gather Logs
Security-related events from your endpoints are gathered and forwarded to your Elastic SIEM instance via an agent in the context of Elastic SIEM.
After that, I would configure the agent to gather logs from my Kali virtual machine and send them to my Elastic SIEM instance.
- I click on the Kibana main menu bar in the top left of the screen after logging into my Elastic SIEM instance, and then I select “Integrations” at the bottom to reach the Integrations page.
- I look for “Elastic Defend” online, click it, and the integration page opens.
- I select “Install Elastic Defend” and proceed with the installation of the agent on my Kali virtual machine by following the guidelines on the integration page.
- After that, I paste that command into the command line of Kali.
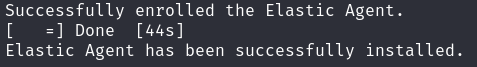
- You will receive a notification stating that the “Elastic Agent has been successfully installed” after the agent has been installed, which may take several minutes. It may take a few minutes for the logs to show up in the SIEM, but it will begin automatically gathering and transmitting data to your Elastic SIEM server.
You will receive a notification stating that the “Elastic Agent has been successfully installed” after the agent has been installed, which may take several minutes.
Task 4: Creating Security Events in the Kali Virtual Machine
One can create some security-related events on your Kali virtual machine (VM) to confirm that the agent is operating as intended. We can use a tool like Nmap to accomplish this. A free and open-source tool for network administration, exploration, and security auditing is called Nmap (Network Mapper). Its purpose is to identify hosts and services on a computer network, generating a network “map” in the process. Nmap may be used to find out what operating system and software are installed on a target system, check hosts for open ports, and obtain further network information.
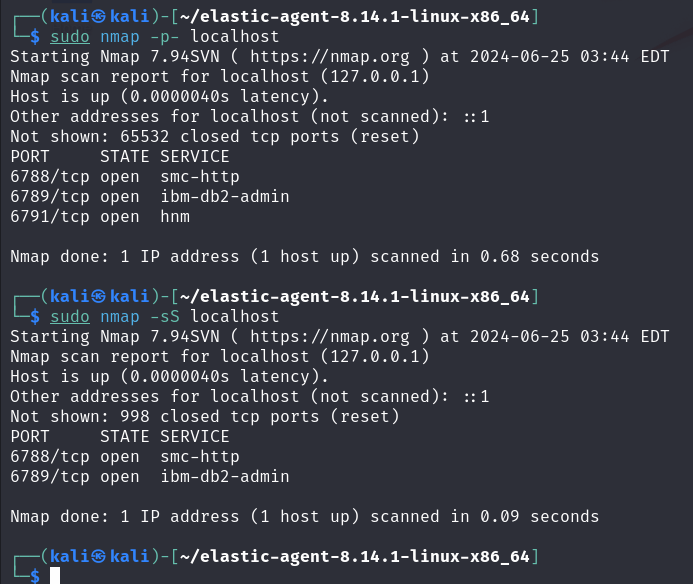
Several security events are produced by this scan, including the identification of operating services and the discovery of open ports.
Task 5: Using the Elastic SIEM to Query for Security Events
We can now begin searching through and examining the SIEM’s logs after moving data from the Kali VM.
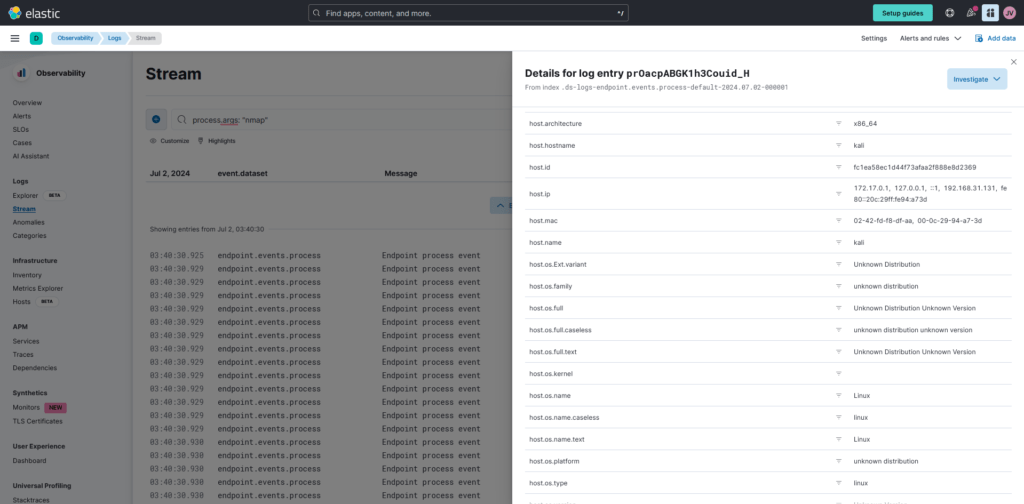
- To access the logs from the Kali virtual machine, I click the “Logs” tab under “Observability” after selecting the menu icon with three horizontal lines in the upper-left corner of the Elastic Deployment.
- I typed a search query into the search window to narrow down the logs. For instance, type the following query to go through all logs pertaining to Nmap scans: “nmap_scan” for event.action and “sudo” for process.args.
- After that, I click the “Search” button to start the search.
- The table that follows will show the search query’s results. I may then view more details by clicking on the three dots that are adjacent to each incident.

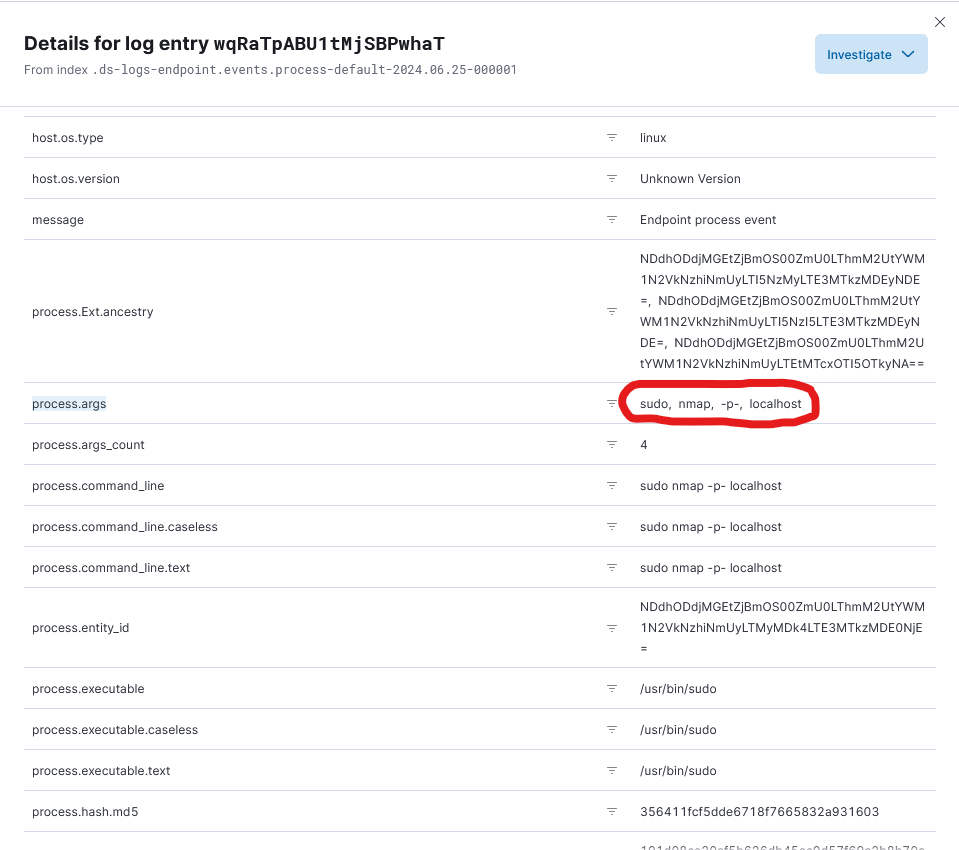
One can learn more about how security incidents are found, looked into, and handled in real-world settings by creating and examining various security event types in Elastic SIEM, such as the one above, or by creating authentication failures caused by a user entering the wrong password or trying to log in to SSH with the wrong password.
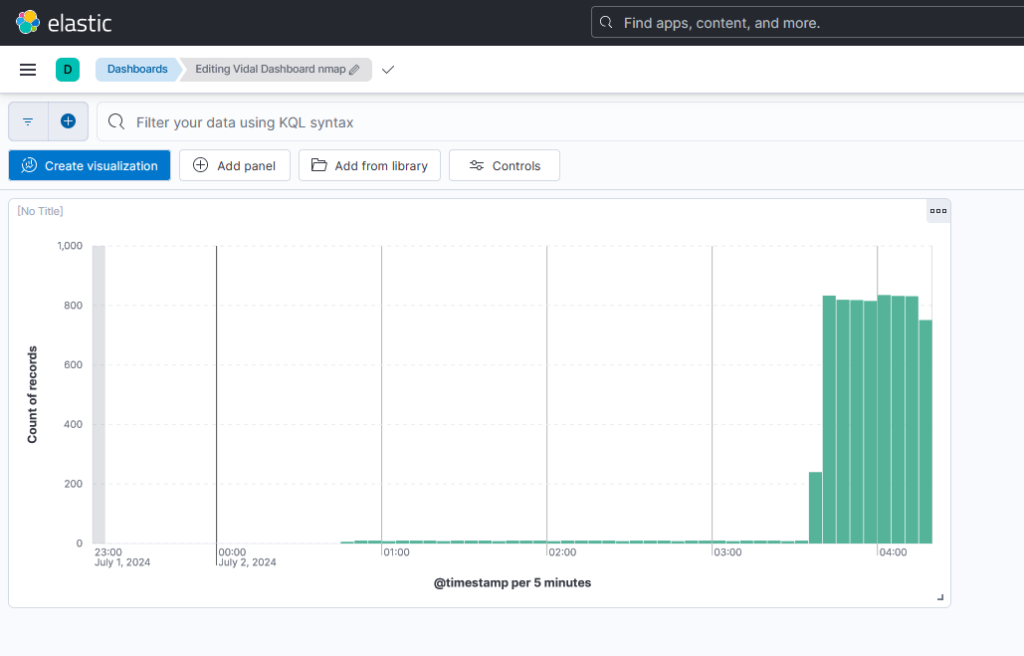
Task 6: Construct a Dashboard for Event Visualization
The SIEM app’s dashboards and visualizations can be used to examine logs and spot trends or abnormalities in the data. I could, for instance, make a straightforward dashboard that tracks the number of security occurrences over time.
This is how I went about it:
- I navigated to https://cloud.elastic.co/, the Elastic web site.
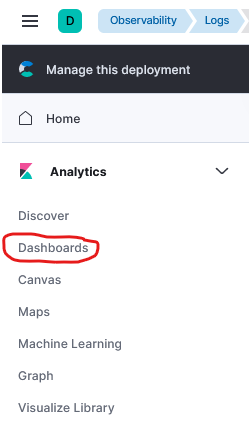
- After selecting the menu icon in the upper left corner, select “Dashboards” under “Analytics.”
3. To start a new dashboard, click the “Create dashboard” icon in the upper right corner.
4. To add a new visualization to the dashboard, click the “Create Visualization” option.
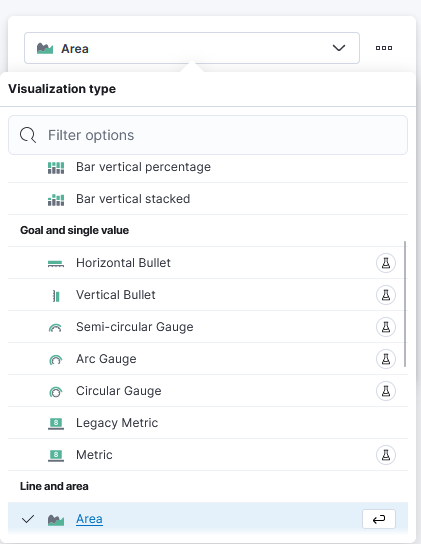
5. Based on your desire, choose “Area” or “Line” as the visualization type. A chart displaying the number of incidents over time will be produced as a result.
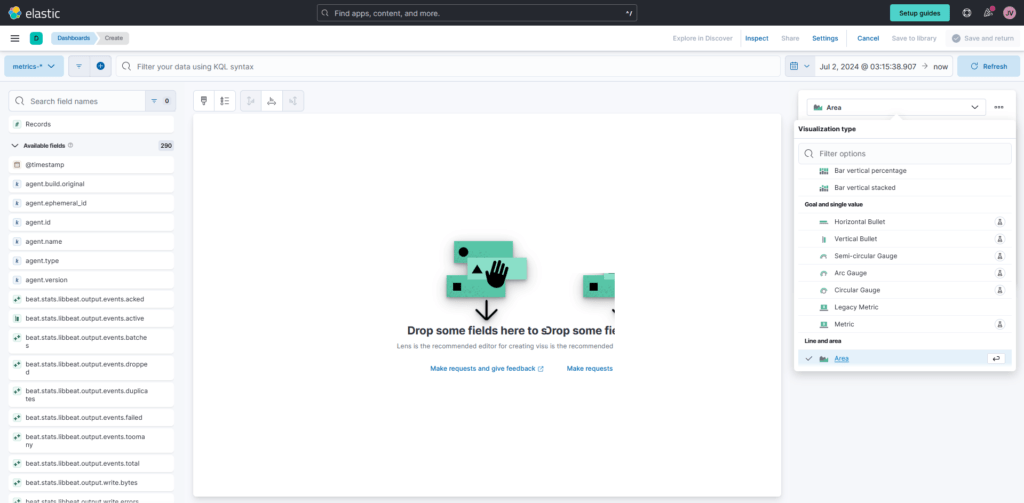
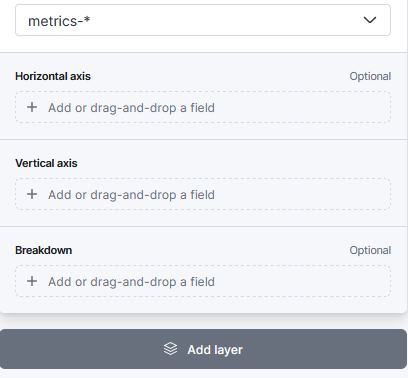
6. Choose “Count” for the vertical field type and “Timestamp” for the horizontal field in the “Metrics” section of the visualization editor on the right. This will display the number of occurrences over time.
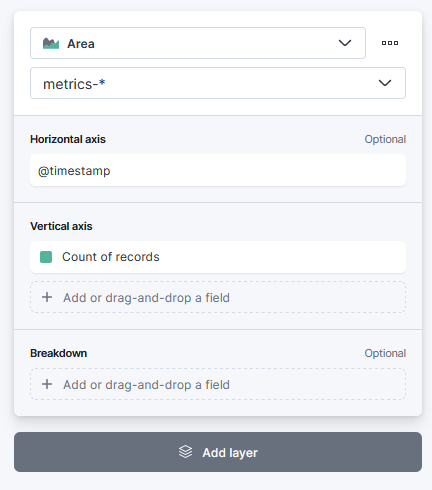
7. After that, I finished the remaining parameters and clicked the “Save” button to save the visualization.
Task 7: Establish a Warning
Alerts are an essential component of a SIEM that help identify security events and quickly address them. Alerts can be set up to perform particular actions when predetermined criteria are fulfilled, and they can be generated using established rules or bespoke queries. We will go through the process of setting up an alert in the Elastic SIEM instance to find Nmap scans in this task. You can set up an alert to be notified when Nmap scan events are found in your logs by following these Step.
Here’s how I went about it:
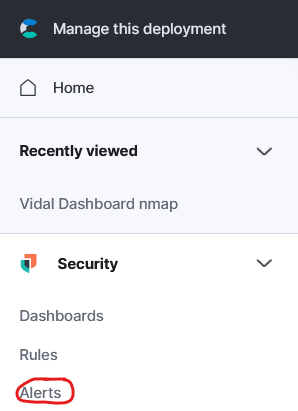
1. After selecting the menu icon in the upper-left corner, select “Alerts” under “Security.”
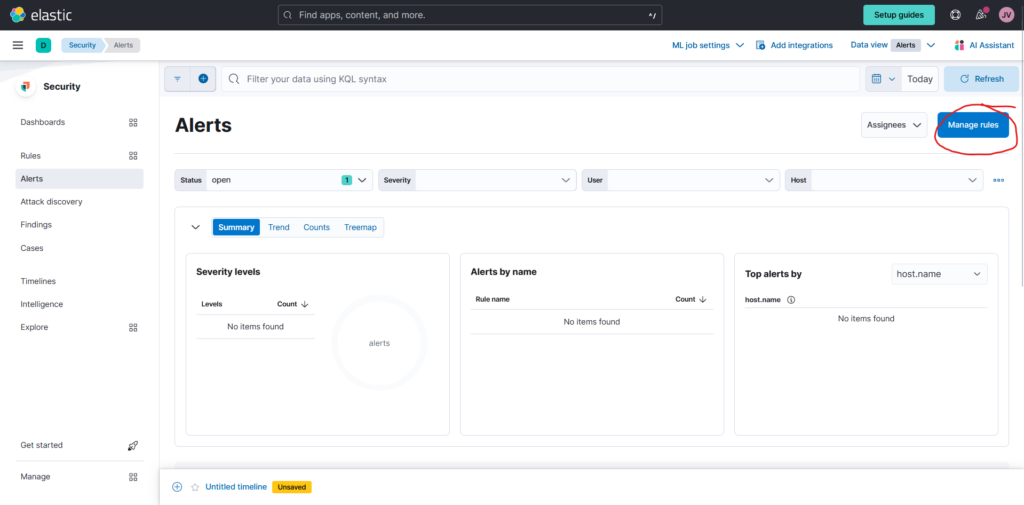
2. Select “Manage rules” located in the upper right corner.
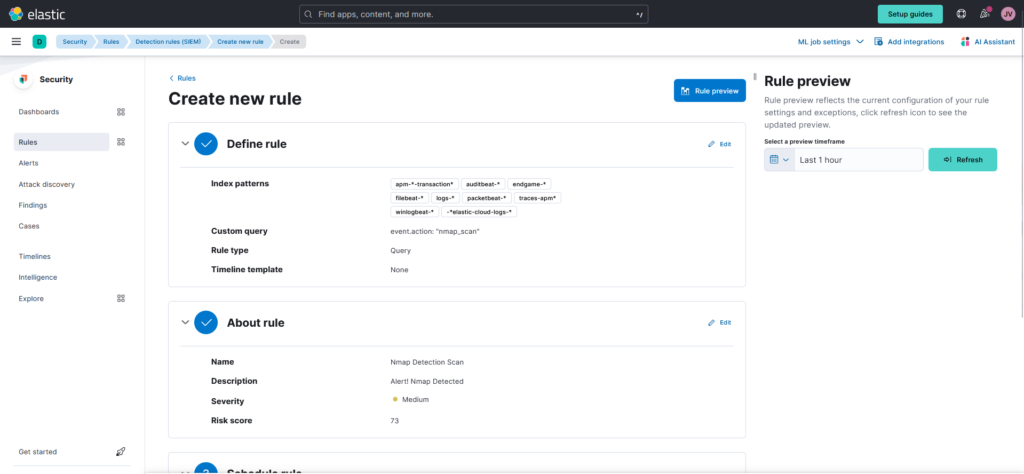
3. I selected the “Create new rule” option located in the upper right corner.
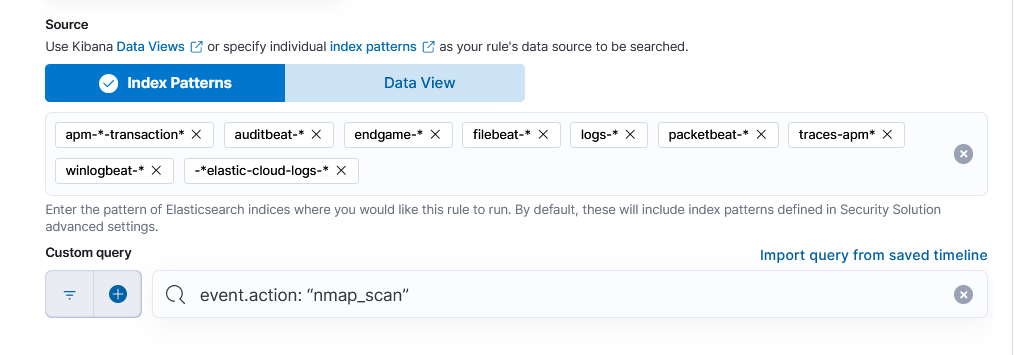
4. Choose the “Custom query” option from the dropdown menu under the “Define rule” section.
5. Define the rules’ conditions under “Custom query.” The following query can be used to find Nmap scan events. All events that match the action “nmap_scan” will be matched by this query. Next, select “Continue.”
6. Name and describe your rule (Nmap Scan Detection) under the “About rule” section.
7. You can prioritize notifications according to their importance by setting the alert’s severity level. Click “Continue” after maintaining all other default settings under “Schedule rule.”
8. Choose the action you wish to do when the rule is triggered from the “Actions” section. You have the option to start a custom webhook, start a Slack chat, or send an email notification.
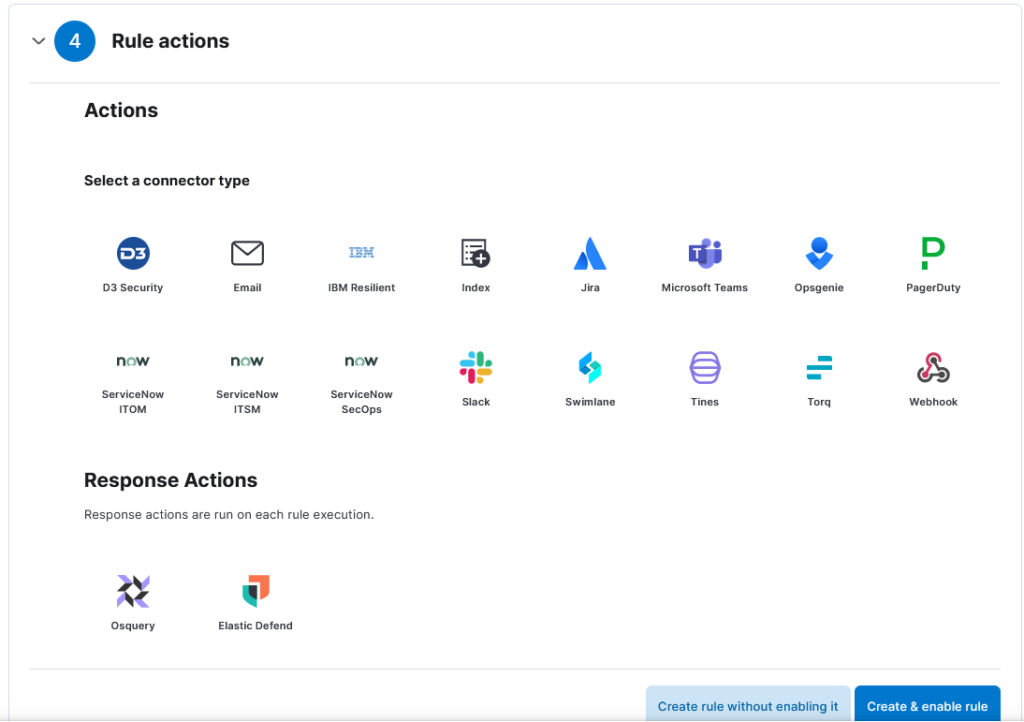
9. In order to create the alert, click the “Create and enable rule” option.
It will keep an eye out for Nmap scan events in your logs after I generate the alert. The alarm will sound and the chosen action will be carried out if a Nmap scan event is found. Under “Security,” go to the “Alerts” section to view and manage your notifications.
Using the help of this home lab, one can acquire and hone the skills required for efficient security monitoring and incident response using Elastic SIEM. I’ve developed practical knowledge with utilizing a SIEM and enhanced my abilities in security monitoring that assists in becoming a productive security analyst or engineer.